
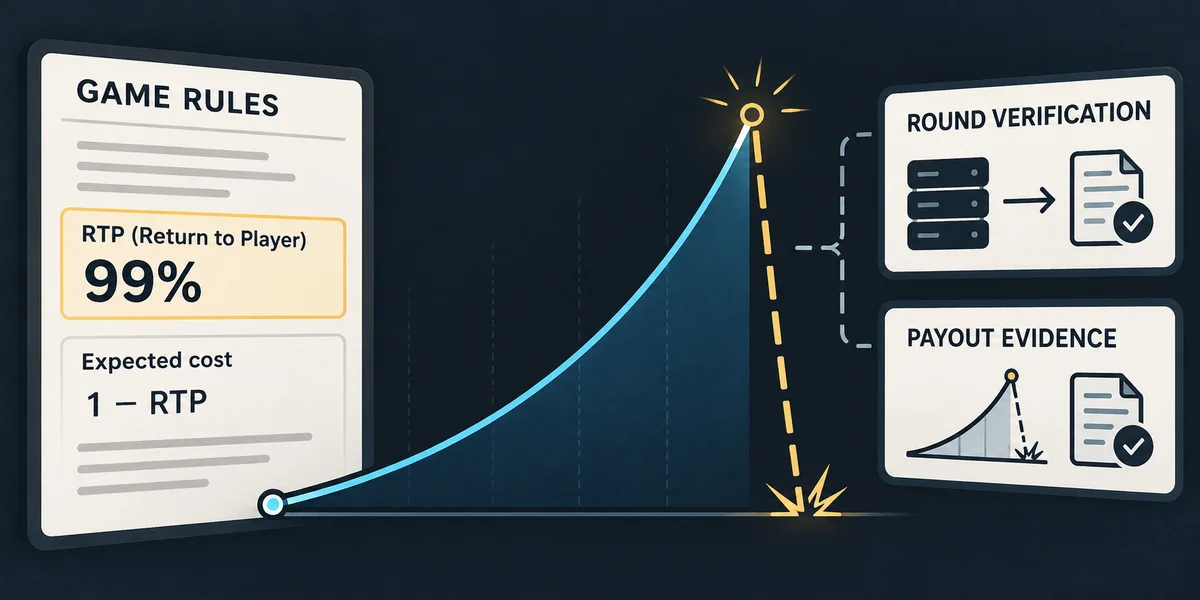

Stake publishes a 99.00% RTP and a 1.00% house edge for Stake Crash. At the same betting turnover, a 1% model has a lower expected cost than a 3% model. That is a concrete comparison of return assumptions. It does not establish the outcome of your next session, guarantee a longer-lasting bankroll or validate an independently written piece of verification code.
This article separates the provider's published specification, the arithmetic of an explicit probability model and the evidence needed to check a completed round. It does not report a laboratory study of live Stake rounds or a verified customer payout. The source for the product figures is the official Stake Crash page, rather than a synthetic CSV presented as casino telemetry.
1. What 99% RTP actually describes
Return to player is a theoretical gross-return measure relative to wagers. In a model with 99% gross return, expected net result is -1% of turnover before any additional costs excluded from that model. Returning a winning stake is part of the gross payout, not extra profit. A player who stakes 10 units and receives 20 at 2x has earned 10 net units, not 20.
A published RTP is not a promise that an account finishes with 99% of its initial deposit. Initial capital and turnover are different quantities: the same money can be wagered repeatedly. Nor does RTP determine a session's chance of finishing ahead, its maximum drawdown or the frequency of the displayed 1.00x value. Those questions require the relevant distribution, settlement rules, stake policy and horizon.
Stake's current product page supports its declared 99% figure. This article does not independently establish that specification through production logs. The distinction matters because an operator statement, a reproducible mathematical example and a complete empirical round audit answer different questions. A confident label cannot substitute for the missing observations.
2. A transparent comparison with a 3% model
For comparison, assume independent rounds and a fixed target k greater than 1, with probability p = (1-e)/k. A one-unit stake earns k-1 on a hit and loses one on a miss. Expected net result is therefore p × (k-1) - (1-p) = k × p - 1 = -e. This is the declared ideal model, not a claim that every game's rounding, caps and cashout rules are identical.
| Ideal-model quantity | 1% edge | 3% edge |
|---|---|---|
| Gross RTP | 99.00% | 97.00% |
| Hit probability at 2x | 49.50% | 48.50% |
| Hit probability at 10x | 9.90% | 9.70% |
| Expected cost at turnover 100000 | 1000 | 3000 |
The 3% column is a comparison assumption, not an operator-wide rating for 1win or an authenticated protocol for Lucky Jet or Aviator. The 1% column illustrates the published Stake Crash return parameter. It does not supply an exact implementation from a digest to a real game outcome. At 2x, the ideal hit rates differ by one percentage point; that difference should not be confused with a percentage-point change in the chance of avoiding bankruptcy.
Lower targets increase the hit rate while reducing profit on each hit. A high hit rate alone does not create an advantage. Under the stated ideal model, changing a target changes variance but leaves expected net cost per unit wagered at e. Exact game limits, equal-target handling, execution and discrete rounding still need to be checked separately.
3. Why a general HMAC page is not a Crash verifier
Stake's general implementation documentation describes HMAC-SHA256 byte generation using a server seed, client seed, nonce and cursor or round component. Generating a digest is only one stage. The conversion of bytes into a particular game's event is another stage, and it must match the version being checked.
It is not sufficient to take the first 13 hexadecimal characters, add a familiar inverse-probability formula and call the result the exact Stake Crash algorithm. Input separators, text encoding, cursor handling, byte extraction, rounding and exceptional outcomes all affect reproduction. A script may execute without errors and still calculate a different model.
The Stake-context HMAC mode in the CrashMath hash calculator is explicitly an illustrative example. It is not an authenticated Stake Crash verifier. Its successful calculation means the supplied inputs produced that example result; no recorded round or earlier commitment has automatically been compared. The separate Aviator SHA-512 branch also must not be substituted for a Stake protocol.
4. The double-edge error in a plausible-looking formula
Consider a hypothetical 52-bit integer I and u = I / 2^52. One illustrative mapping uses a 0.99 coefficient in its payout curve. Another additionally forces a result of 1 when I is divisible by 101. That extra condition removes almost one additional percent of otherwise winning outcomes. It cannot be added while still describing the combined model as having exactly a 1% edge.
| Illustrative mapping | Hit probability at 2x | Gross return at 2x |
|---|---|---|
| 0.99 coefficient only | 0.49500000 | 0.99000000 |
| 0.99 plus modulo 101 | 0.49009901 | 0.98019802 |
For a 2x target, the compounded example has hit probability approximately 0.490099 and gross return approximately 0.980198. Those values describe the example's mathematics, not measured Stake performance. The modulo condition is applied to an integer derived from the same hash, so exact finite counting and target boundaries matter; the displayed figures are rounded comparisons.
The frequency of displayed instant crashes is a further separate quantity. Rounding and a minimum multiplier can create 1.00x results even without a standalone modulo branch. A declared 1% house edge therefore does not, by itself, prove that exactly one round in 100 displays 1.00x. We do not publish an observed instant-crash rate without a genuine dataset and a stated counting rule.
5. Expected cost at equal turnover
Take 100,000 units of funded turnover under the two constant-edge models. Expected cost is 100,000 × 0.01 = 1,000 units at 1%, and 100,000 × 0.03 = 3,000 at 3%. The difference is 2,000 units of expected cost. Equivalently, 10,000 funded wagers of 10 units have that turnover. These are arithmetic illustrations, not observed customer losses.
Reducing the expected cost to one third does not prove that a bankroll survives three times as many rounds. Survival also depends on initial capital, target, stake progression, payout limits and when play stops. A formula that simply extends a funded-betting ledger below zero invents credit the player did not have. A funded simulation stops before an unaffordable next stake or defines an explicit smaller final stake.
When stopping makes turnover random, expected cumulative loss is linked to expected turnover under the model's valid expectation conditions. It is not automatically the edge multiplied by the maximum requested number of bets. Fees and conditional bonus effects also require their own treatment. Compare like with like: the same eligible game, currency, funded exposure and settlement assumptions.
6. Bankroll sizing does not turn the edge positive
At target k in the ideal 1% model, the unconstrained Kelly fraction is -0.01 / (k-1). For a player who can only place nonnegative bets on that game, the optimal Kelly stake is zero. Calling a voluntary 1% spending fraction “fractional Kelly” does not change that result: a fraction of a constrained zero optimum remains zero.
A recreational limit can make expenditure easier to track, but it is a chosen budget rule rather than a source of positive expectation. Recalculating 1% of the remaining balance differs from keeping a fixed unit equal to 1% of the initial balance. Minimum stakes can break either percentage rule. Define the implementation before comparing trajectories or calling one approach safer.
7. What a genuine round check would require
Start with the exact game's own fairness record and rules. Preserve the commitment that existed before the relevant event, the revealed seed inputs, any game-specific counters and the expected recorded result. Check the commitment relation and then recompute the outcome with the documented conversion. A comparison requires something recorded to compare against; calculating a number alone is insufficient.
A match can support consistency of those inputs and that result. It does not establish that secrets never leaked, every omitted round was handled identically, a withdrawal was paid or customer funds were held in a particular way. A statistical distribution test addresses another question again. Not rejecting a probability model is not a certificate of cryptographic integrity or operator conduct.
The public CrashMath 10,000-row dataset is a labelled simulation. It cannot supply missing Stake round IDs, production timestamps or paid-win records. No independent production study, measured RTP confidence interval or payment audit is presented here.
8. Use the comparison for a concrete choice
If expected cost is your comparison criterion, the published 99% Stake Crash RTP is relevant. Before choosing, check that the displayed game is the intended product and review its local availability, stake and payout limits, cashout controls and current cashier terms. An operator's other games and promotions do not automatically share this game's return specification.
You can inspect the mathematical examples first or use the direct platform actions below. Those routes do not guarantee an immediately available demo, establish an already-verified round or bypass the platform's own conditions. The useful conclusion is the bounded one: at equal funded turnover, a lower declared edge reduces model expected cost, while actual outcomes and verification need their own evidence.